Viewing system information on Ubuntu.
Linux operating systems include by default several command line tools to view information about the actually installed operating system, and the kernel, as well as about the hardware, in particular the CPU, memory and disk usage. Desktop distributions also include some GUI applications to view this info. The following text is about Ubuntu 20.04; however, the console utilities should be installed or available on most other Linux distributions, too.
OS release version and kernel version.
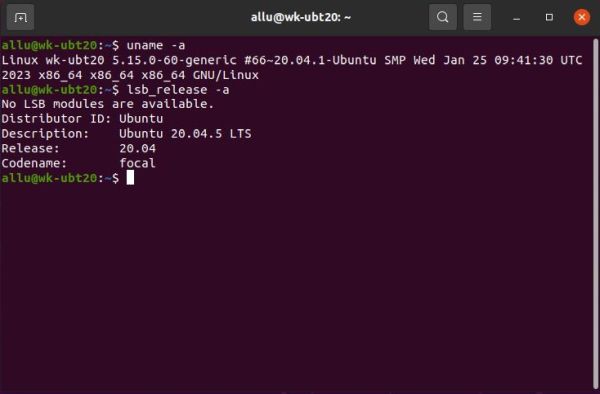
You can display basic information about the actually used kernel, using the command
uname -a
The output includes, among others, the kernel version number, the processor type, and the system architecture.
To get information about the OS release version, run the command
lsb_release -a
The info displayed includes the operating system version number, code name, and distribution description.
 |
Memory and disk space usage.
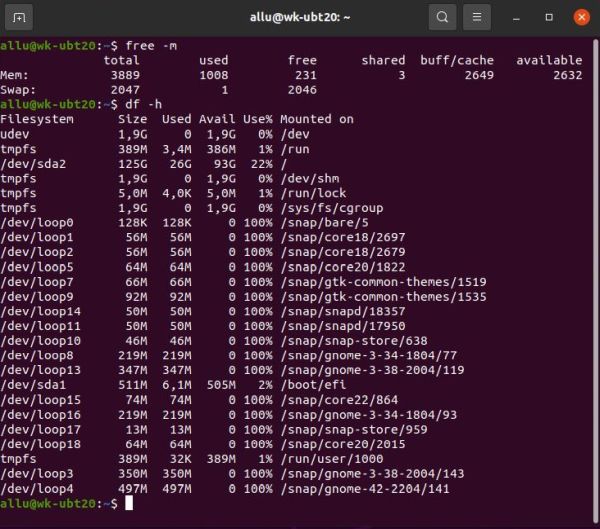
You can display basic information about your computer's memory usage, using the command
free -m
The output includes the total amount of RAM installed, the amount of RAM currently in use, and the amount of free RAM available.
To obtain information about your computer's disk usage, run the command
df -h
The info displayed includes the total amount of disk space available, the amount of space used, and the amount of free space.
 |
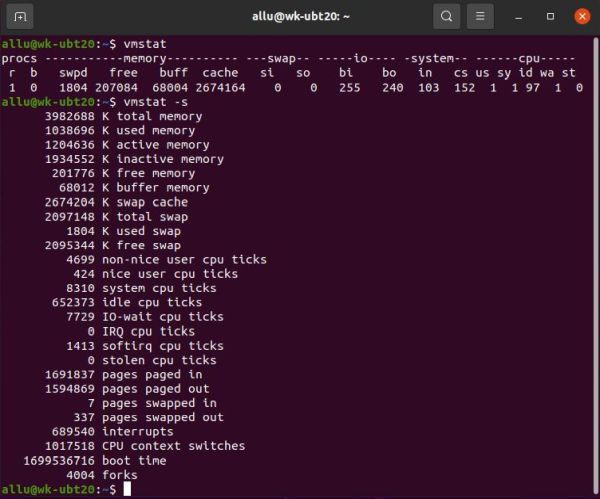
The vmstat command is used to display virtual memory statistics of the system. The command reports data about the memory, paging, disk
and CPU activities, etc. A general overview is obtained, using the command without parameter. Memory details may be viewed by specifying the parameter
-s.
vmstat
vmstat -s
 |
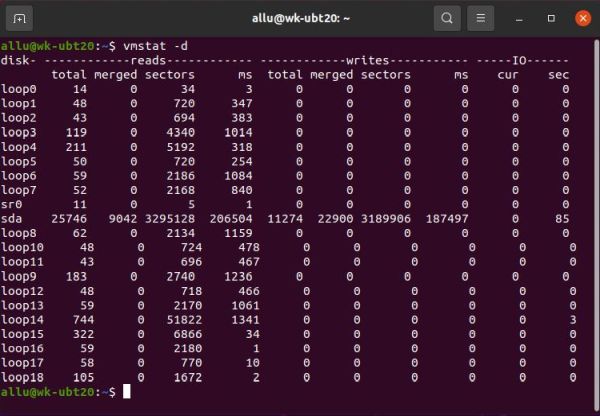
To view disk statistics, specify the -d command line parameter.
vmstat -d
 |
Process CPU and memory usage.
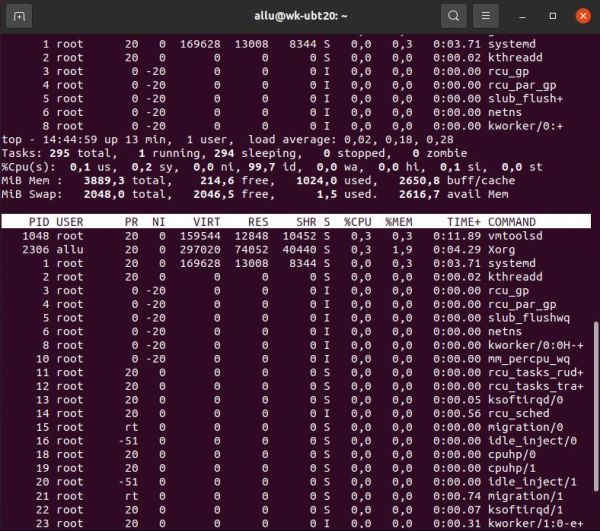
The command top displays real-time information about the system’s CPU and memory usage, including the percentage
of CPU usage for each running process, the amount of RAM in use, and the amount of free memory available. This can be useful to monitor system performance and
to identify processes that cause high CPU or memory usage.
top
 |
The command htop provides the same information as the top command but with a more user-friendly interface. It allows for more straightforward navigation and sorting of the processes and also includes color-coded display for easier readability.
The htop utility is not present by default on Ubuntu, so before you can use it, you'll have to install it:
sudo apt install htop
After installation, you can use the utility in the console by typing the command
htop
or launch it from "All Applications".
![Ubuntu system information: Process real time infoemation, using the 'htop' command [1] Ubuntu system information: Process real time infoemation, using the 'htop' command [1]](../screenshots/ubuntu_sysinfo6a.jpg)
|
![Ubuntu system information: Process real time infoemation, using the 'htop' command [2] Ubuntu system information: Process real time infoemation, using the 'htop' command [2]](../screenshots/ubuntu_sysinfo6b.jpg)
|
System info desktop applications.
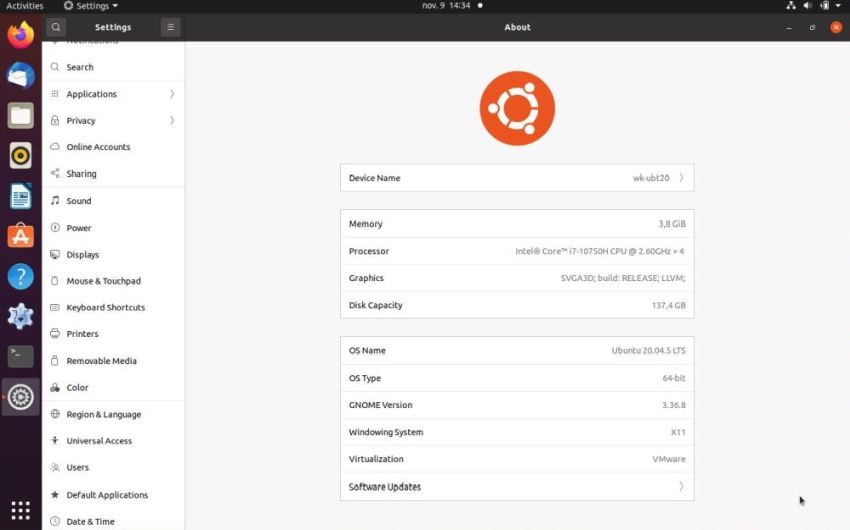
On Ubuntu, you can view a brief summary about your system hardware and software, using Settings > About. This displays the host name, the available RAM, the processor type and graphics card model, the available disk space, as well as information concerning the operating system and the Desktop installed.
 |
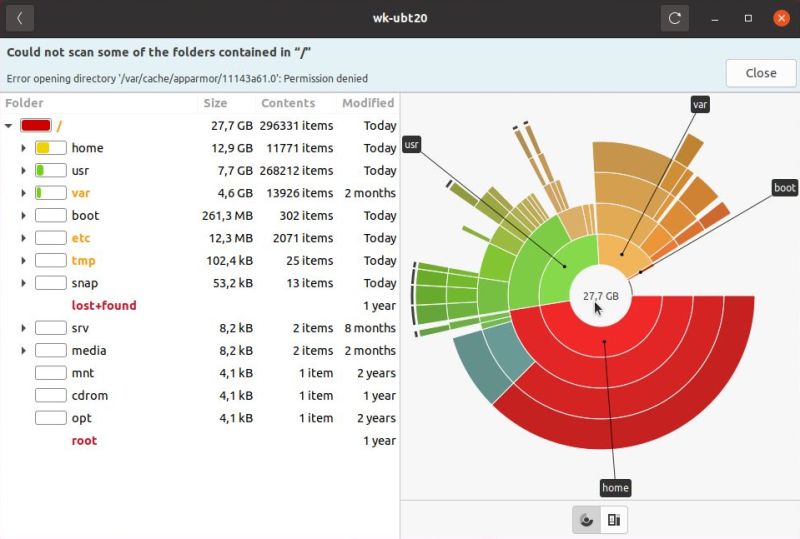
Ubuntu also includes by default an application to view disk space usage. It is called Disk Usage Analyzer and can be launched from "All Applications". On the screenshot below, you can see how much space the directories immediately beneath the root are actually using.
 |
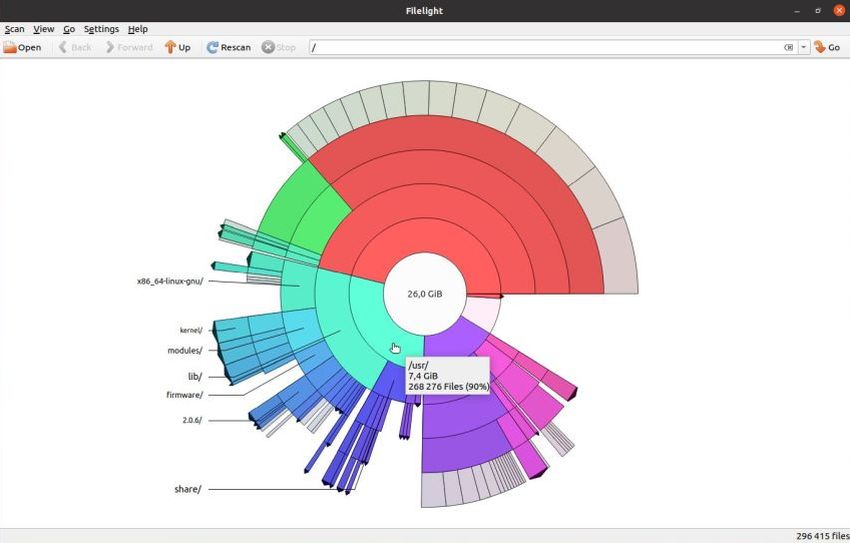
I don't know how much Ubuntu specific this application is. Anyway, there is a practically identical program, that should be available for most Linux distributions. The application is called Filelight. I installed it on my Ubuntu 20.04; on the screenshot below, you can see what the display looks like (here, the disk space usage details of the /usr directory).
 |
Note: Filelight also exists for the latest Windows releases and can be installed from the Microsoft Store.
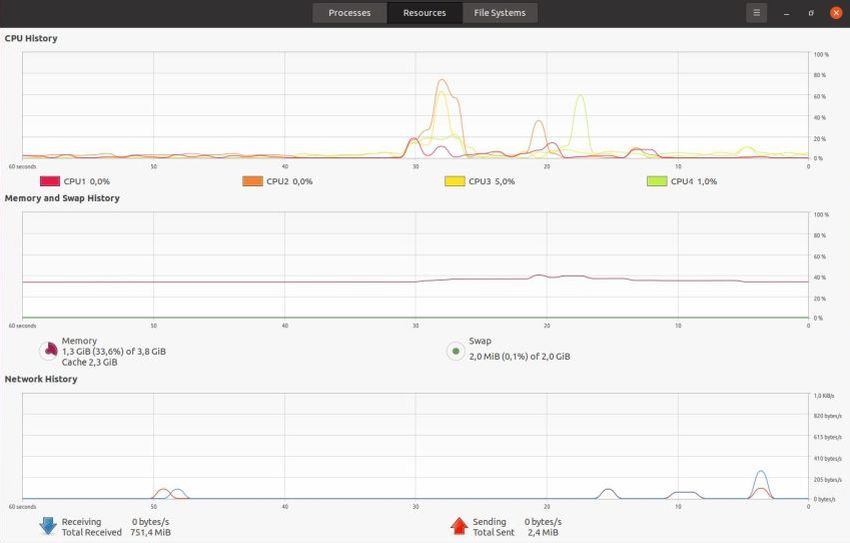
If you are a Windows user, you probably know the Task Manager application, that you can use to view the currently running services and processes, as well as to display, in real time, how much system resources are used. There is a similar application included by default with Ubuntu, where it's called System Monitor. As in Task Manager, you can view, in real time, which process uses which resources. And you can display the global resource usage (CPU usage, RAM usage, harddisk access, network traffic) of the system. A rather idle system on the screenshot of my Ubuntu 20.04 below. The increase of memory used and the CPU peaks at the same moment correspond to the build of a Lazarus application, that I launched to view the effects on the resource graphs.
 |
If you find this text helpful, please, support me and this website by signing my guestbook.