Installing and running Gnuplot on OS/2.
In my tutorial Introduction to Gnuplot, I describe some of the major features of this amazing command-line driven graphing utility. The tutorial Installing and running Gnuplot on FreeDOS shows how to use the software on a DOS platform. And this tutorial is about its installation and execution on OS/2 Warp 3 (blue spine); I suppose that it also applies to OS/2 Warp 4.
Gnuplot 5.45 for OS/2 can be downloaded from Sourceforge. The distribution has been build for EMX, thus the EMX runtime must be installed to use it. The EMX Runtime, 0.9d fix 4 can be downloaded from the OS/2 Site website.
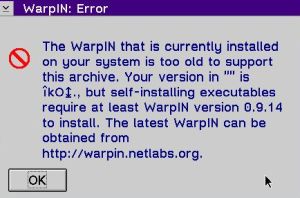
The EMX runtime file is a self-extracting archive. If you try to run it, you will probably get the error message that the installed version of WarpIN is too old to support the archive.
|
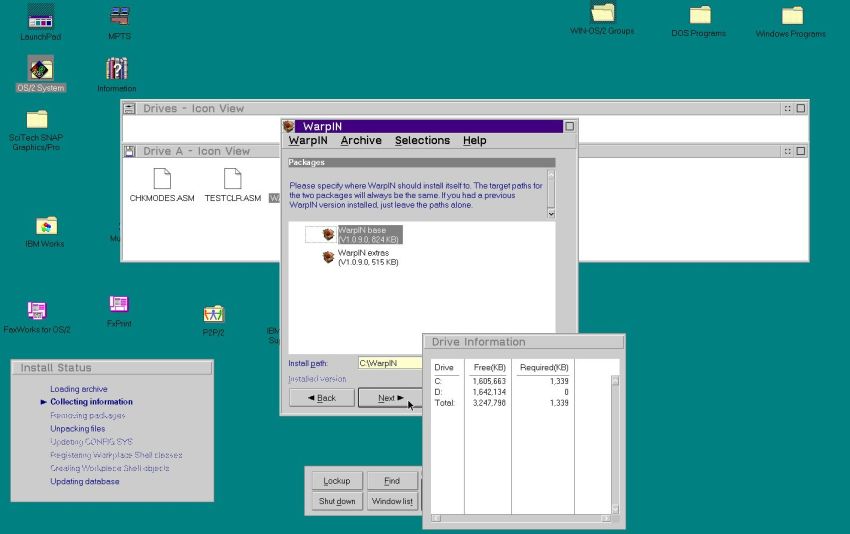
Thus, the first step consists in installing a newer version of WarpIN. WarpIN 1.0.9 is available at the OS/2 Site website. The download is a self-extracting archive; double-click the warpin-1-0-9.exe file to run it. After the Welcome screen, the license agreement and a further information screen, the setup program tells you that there are two packages that will be installed to the directory C:\WarpIN (unless you specify a different one).
|
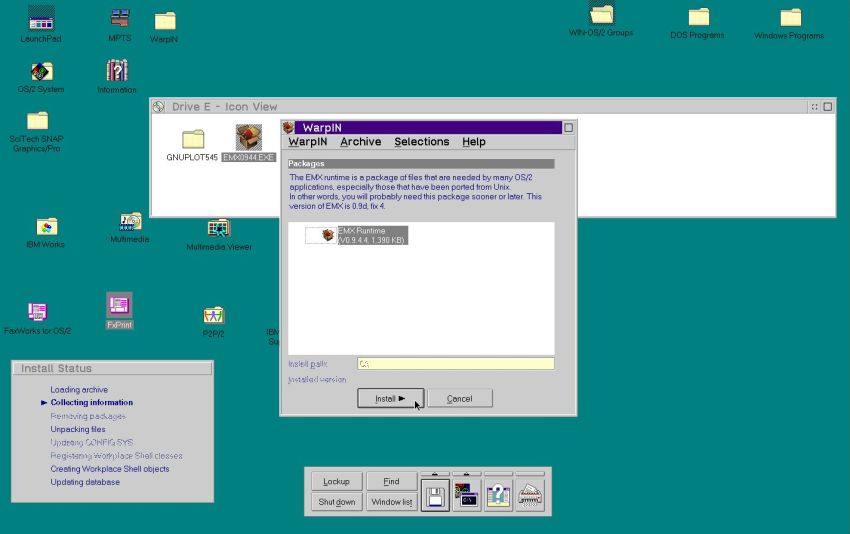
Now, we can install the EMX runtime; double-click the file emx0944.exe to start the setup program. The software will be installed to C:\ (not possible to change this path).
|
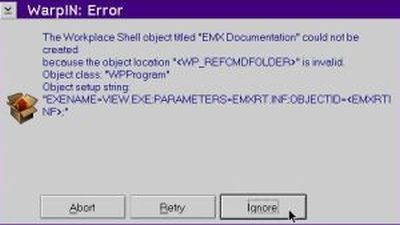
During the installation, I got the error message that a workplace shell object couldn't be created. Just push the Ignore button. I don't know what's the issue here, but I think that this error doesn't effect the correct working of the runtime.
|
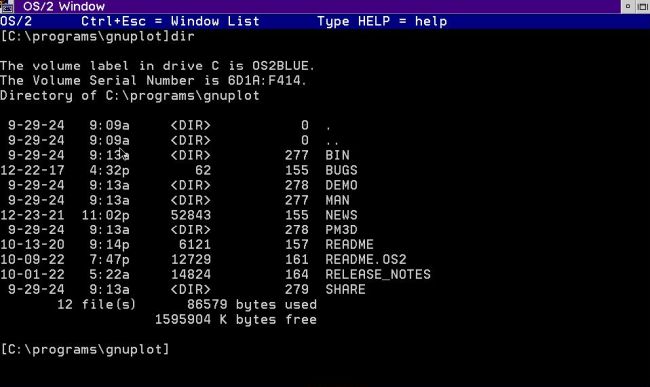
The Gnuplot 5.45 for OS/2 download archive consists of the application's folder structure. I created the directory C:\Programs\gnuplot, and copied the archive content (I had extracted the files on my Windows 10 and put them into a CDROM ISO) to there. The screenshot shows the Gnuplot folders; note that the main executable (gnuplot.exe) is located in the bin directory.
|
As a difference with the DOS version, Gnuplot for OS/2 may be run as an interactive shell where, besides some shell specific commands (e.g. exit to leave the shell), you can enter Gnuplot commands, that are then immediately executed. The screenshots below show the start-up of the shell, where I entered the Gnuplot command plot sin(x) (screenshot on the left) and the generated output (graph of the sine function) (screenshot on the right).
![Gnuplot on OS/2: Interactive shell - Plotting the sine function [1] Gnuplot on OS/2: Interactive shell - Plotting the sine function [1]](../screenshots/os2_gnuplot5a.jpg)
|
![Gnuplot on OS/2: Interactive shell - Plotting the sine function [2] Gnuplot on OS/2: Interactive shell - Plotting the sine function [2]](../screenshots/os2_gnuplot5b.jpg)
|
Instead of entering the Gnuplot commands from the keyboard, you can load them from a Gnuplot commands file (usual file extension = .plt). This
may be done using the command load, with the filename specified between double quotes. It is possible to specify a file path with this
instruction; however note that you'll have to use a double-backslash (\\) instead of the usual single backslash (\) directory separator. Example:
load "c:\\programming\\gnuplot\\3d.plt"
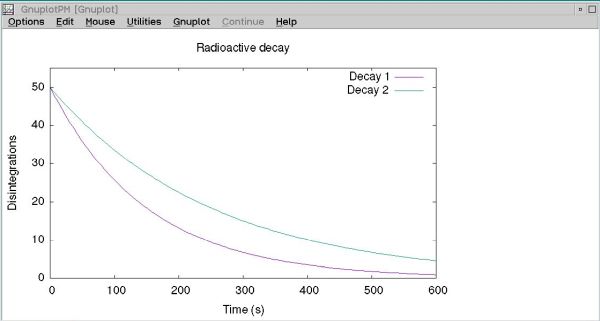
This is my Gnuplot commands file decay.plt. It produces the plot of two graphs showing the radioactive decay of two substances with different half-lives.
set title "Radioactive decay"
set xlabel "Time (s)"
set ylabel "Disintegrations"
set xrange [0:600]
set yrange [0:55]
plot 50*exp(-x/150) title "Decay 1", 50*exp(-x/250) title "Decay 2"
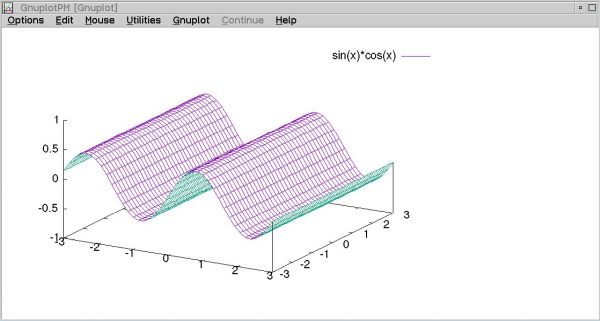
And this is my Gnuplot commands file 3d.plt. It produces a 3D-plot with adapted position of the z-plane.
set zrange [-1.0:1.0]
set isosample 40
set hidden3d
set ticslevel 0
splot [x=-3:3] [y=-3:3] sin(x)*cos(x)
The screenshots show the output produced by these Gnuplot commands files: the radioactive decay on the left, the 3D-plot on the right.
|
|
Instead of running it interactively, we can also run Gnuplot from the command line, what also allows us to run it from inside a program or application; e.g. running it from a Free Pascal program using Exec(). In this case the Gnuplot commands file is specified as a command line argument. This file must contain the information, where to output the plot. This will normally be a graphics (image) file. The png terminal (creating a PNG image file) works well on OS/2.
In this case, we would probably want to be able to run Gnuplot from any directory. This implies not only to add the Gnuplot "bin" directory to the PATH, but also setting some other environment variables (cf. the Gnuplot documentation for details). I actually proceed this way:
- I place my Gnuplot commands files in the directory C:\Programming\gnuplot, and being in this directory when running Gnuplot, the image file will be created there, too.
- First, I run the script startgp.cmd from the C:\Programs\gnuplot\bin directory. This script, included with the Gnuplot installation files, temporarily initializes the Gnuplot environment.
- Then I go to the directory with my PLT files. But, before running Gnuplot, I add the Gnuplot "bin" directory to
the PATH:
set path=%path%;c:\programs\gnuplot\bin - Finally, I run Gnuplot with the PLT file as command line argument. In the case of SINE.PLT (described below):
gnuplot sine.plt
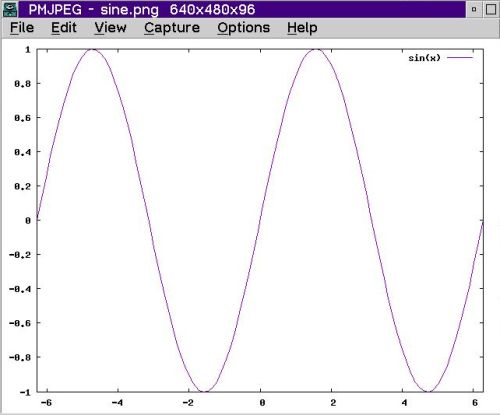
And here is the content of my Gnuplot commands file SINE.PLT. It is intended to create a sine graph to be put out into the file SINE.PNG.
set terminal png
set output "SINE.PNG"
plot [-2*pi:2*pi] sin(x)
The screenshot shows SINE.PLT opened in PMJPEG.
|
If you find this text helpful, please, support me and this website by signing my guestbook.